
🎧 Listen to the Download
Hey everyone! Hope you’re having a great week and sending you all my best wishes for a joyous Diwali! I hope you all had a wonderful time with your loved ones.
Welcome to this week’s “Synopsis” of DevGyan. We’ll dive into how a major cloud outage revealed a significant talent gap at one of the world’s biggest tech companies. We’ll also explore a simple guide to building interactive web apps with Shiny, showing how quick prototyping can reveal new data insights.
Checkout Synoposis, the LinkedIn newsletter where I write about the latest trends and insights for data domain. Download is the detailed version of content covered in Synopsis.
Shiny 101: Launch Your First Shiny App in Minutes
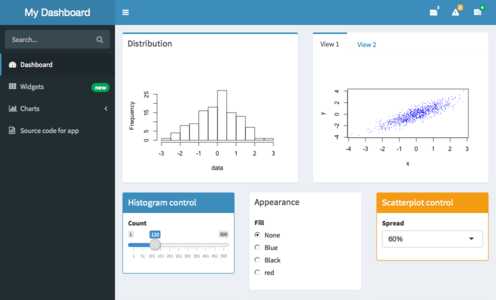
New to Shiny in R? This Mastering Shiny chapter walks you through creating a minimal Shiny web app in R, covering the essential UI, server, and reactive components. It starts with installing Shiny, then builds a simple app.R that displays “Hello, world!”. From there, you add input controls (selectInput) and outputs (verbatimTextOutput, tableOutput), demonstrating how to wire them together in the server function with renderPrint() and renderTable(). The final segment introduces reactive expressions to eliminate duplicated dataset retrieval code, illustrating efficient state management.
- UI:
fluidPage()+selectInput() - Server:
renderPrint()/renderTable()callbacks - Reactivity:
reactive({ … })to cache expensive operations
Boilerplate Code
The app.R file must contain three parts:
- Load the shiny package: library(shiny)
- Define the UI: Creates the HTML structure and controls (how the app looks).
- Define the Server function: Contains the logic for the app (how the app works).
- Launch the App: shinyApp(ui, server)
A trivial example:
library(shiny)

ui <- fluidPage(
  "Hello, world!"
)

server <- function(input, output, session) {
  # Logic goes here
}

shinyApp(ui, server)
Running and Stopping
Run: Click the Run App button in RStudio, use the keyboard shortcut Cmd/Ctrl + Shift + Enter, or use shiny::runApp() with the directory path.
Blocking: While running, the app blocks the R console, meaning you can’t run other commands.
Stop: Click the stop sign icon in the console, press Esc in the console, or close the app window. In RStudio, you can Reload the app to see code changes without restarting.
Components: UI, Server, and Reactivity
The User Interface (UI)
The UI defines the layout and controls. It uses functions to generate HTML elements.
Layout Function: Functions like fluidPage() set up the basic structure.
Input Controls: Functions that let the user provide a value, like selectInput(). These have a unique ID (e.g., “dataset”).
Output Controls: Functions that tell Shiny where to display results, like verbatimTextOutput() or tableOutput(). These also have a unique ID (e.g., “summary”).
ui <- fluidPage(
    # Input control: 'dataset' is the ID
    selectInput("dataset", "Dataset", choices = ls("package:datasets")),
    # Output controls: 'summary' and 'table' are the IDs
    verbatimTextOutput("summary"),
    tableOutput("table")
)
The Server Function
The server function contains the “recipes” for generating the outputs based on the inputs. It takes three arguments: input, output, and session.
Input Values: The user’s input values are accessed using the input object, typically as input$ID (e.g., input$dataset).
Output Definition: Outputs are defined by assigning a render function wrapped around a code block to a specific output ID on the output object (e.g., output$summary <- renderPrint({…})).
Reactive Programming: Shiny’s reactivity automatically updates outputs when their associated inputs change. The simple act of referencing an input$ID within a render function establishes this dependency.
Example Server Logic:
server <- function(input, output, session) {
    # Output for the statistical summary
    output$summary <- renderPrint({
        # Referencing input$dataset establishes a dependency
        dataset <- get(input$dataset, "package:datasets")
        summary(dataset)
    })

    # Output for the data table
    output$table <- renderTable({
        dataset <- get(input$dataset, "package:datasets")
        dataset
    })
}
Reducing Duplication with Reactive Expressions
Duplicated code within the server function (like retrieving a dataset multiple times) is inefficient and hard to maintain. Reactive expressions solve this by caching a computation’s result.
Create: Wrap the duplicated code in reactive({…}) and assign it to a variable (e.g., dataset <- reactive({…})).
Use: Call the reactive expression like a function (e.g., dataset()).
Example with Reactive Expression:
server <- function(input, output, session) {
    # 🌟 Reactive expression defined once, caches the dataset
    dataset <- reactive({
        get(input$dataset, "package:datasets")
    })

    output$summary <- renderPrint({
        summary(dataset()) # Called like a function
    })

    output$table <- renderTable({
        dataset()          # Called like a function
    })
}
My Take
From a data analytics lens, this tutorial exemplifies the power of declarative programming: you describe what the UI should look like and how outputs should react, leaving Shiny to handle the underlying event loop. The use of reactive expressions is a clean pattern for avoiding redundant data loads—essential for scaling apps that pull from databases or APIs. Moreover, the clear separation of concerns (UI vs. server) aligns with best practices in web development, making the codebase maintainable and testable. As you progress to more complex visualizations, keep an eye on reactive caching and dependency tracking to keep latency low.
Quick Reference Checklist
- Install & load shiny (
install.packages("shiny")) - Create
app.Rwithui+server - Run app via RStudio toolbar or
shiny::runApp() - Add inputs/outputs → wire in server
- Wrap expensive calls in
reactive({ … })
When the Cloud Faints: Why AWS’s Brain Drain Hits the Internet
What Happened?
AWS’s US‑EAST‑1 region went dark on Oct 20 — DNS hiccups at the DynamoDB endpoint triggered a domino effect that knocked out banking, gaming, social media, and more. Within 75 minutes, engineers traced the root cause to a DNS resolution failure, but the public status page remained vague until later. The outage exposed how much the cloud depends on institutional knowledge that seems to be evaporating.
Why It Matters
- DNS is the silent killer – a small misstep cascades across services.
- Talent exodus – 27,000+ Amazonians laid off (2022‑2025) and 69‑81 % regretted attrition.
- Legacy systems need legacy people – senior engineers who “know the ropes” are leaving, leaving teams to rebuild from scratch.

My Take
From a data‑engineering lens, this outage is a classic symptom of knowledge loss more than a tech flaw.
- Detection lag = 75 minutes → higher MTTR (Mean Time to Recovery).
- Redundancy relies on people, not just code.
- The “Frugality” principle is turning into “frugality of expertise,” raising the risk of repeated failures.
If AWS wants to keep the cloud humming, retaining and onboarding deep‑domain experts must become a priority, not an afterthought.
In a world where the internet literally stops, the real hero isn’t the code—it’s the people who keep it running.
Final Thoughts
In this edition of Download, we explored two critical themes shaping the data landscape today. First, we saw how Shiny empowers data professionals to rapidly prototype interactive web applications, highlighting the importance of declarative programming and reactive design patterns. Second, the AWS outage underscored the profound impact of talent retention on cloud reliability, reminding us that behind every robust system are skilled individuals whose knowledge is irreplaceable. As we navigate an increasingly complex data ecosystem, balancing technological innovation with human expertise will be key to sustaining progress and resilience.